Running a requirements analysis using the Kano method for the first time can admittedly be a daunting task. To remedy this post gives you a comprehensive summary of the needed questionnaire and explains how the evaluation works. Hopefully, this will help you get started with the Kano method.
Taking the user’s perspective
The Kano method results in a clear prioritization of possible product features. This happens based on your user’s opinion. To achieve this, potential users are asked to rate a number of planned features using the Kano questionnaire. In order to develop or define appropriate features, you should ask users, which features they consider necessary and which features they would enjoy on top of that (about 30 opinions on this question are plenty).Of course, you have to keep in mind that this very direct assessment is unlikely to result in innovative new ideas, as users will have a hard time coming up with truly original ideas. As the people being surveyed also tend to forget mentioning must-be features-they assume that you already thought of those and will, of course, provide them-you should also include ideas generated in your development team. It’s also a good idea to let stakeholder put in their two cents.
Preparing for and running a Kano survey
One a pool of possible future features has been defined the question raises, which of those features actually provides users with additional value and has the potential to delight them. This is where the Kano method comes into play.The standardized Kano questionnaire proposes two questions that need to be answered for every feature. The functional questions measure users’ reaction to the feature being present. The dysfunctional question measures users’ reaction to a product that lacks the feature in question. When describing the features in the questionnaire, it’s important to describe them in the most simple and understandable way possible. Keep in mind that users are not interested in how the feature works, but which of their problems it solves. The functional and dysfunctional question can be answered using one of the following options:
- I like it
- I expect it
- I am neutral
- I can tolerate it
- I dislike it
Evaluating the results
The biggest step towards gaining insight is already taken once the Kano survey has been run correctly. It’s especially important that you make sure to ask the functional as well as the dysfunctional question! In order to gain the maximum benefit from your raw data, you can employ multiple approaches to evaluation. In the following paragraphs, we’ll explain the standard way to categorize features based on the individual answers, the discrete analysis as well as the continuous analysis using a graph.Categorizing answers using the Kano matrix
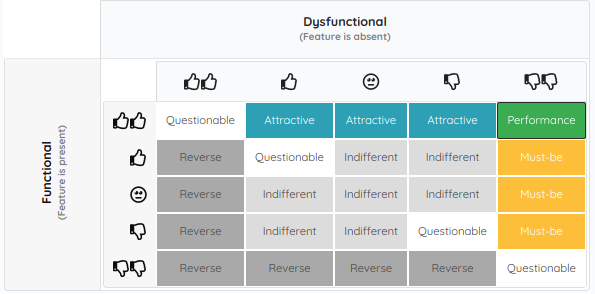
The features that are being asses are categorized into the categories of the evaluation matrix according to the answers given to the functional and dysfunctional question. The rows of the kano matrix below correspond to the answers to the functional question, the columns correspond to the answers to the dysfunctional question.
Kano matrix for categorizing features
Depending on the combination of given answers the feature is placed into one of the five categories listed in the matrix. The categories have the following meaning for the features:
- Must-be feature
- Users’ most basic requirements to the product
- improvement in feature functionality hardly influences users’ satisfaction
- missing must-be features lead to dissatisfaction
- when asked what they need, users won’t explicitly name must-be features as they consider them an obvious prerequisite
- deciding competitive factor: if must-be features are missing, users instantly lose interest in the product
- Performance feature
- Customers’ satisfaction increases proportionally with increased feature functionality
- performance features are usually the ones users explicitly mention when asked what features they want/need
- Delighters
- have the greatest impact on customers’ satisfaction
- implemented delighters influence customers satisfaction disproportionately
- their absence doesn’t result in dissatisfaction
- they are not explicitly demanded or expected
- Indifferent
- customers indifferent whether these features are existent or absent
- customers don’t view these features as useful or valuable
- customers aren’t willing to pay for these features
- Reverse features
- users expect this feature to be absent
- if the feature is present, users’ dissatisfaction will grow
- users actively reject these features
- Questionable
- these features are usually a result of the surveyed person answering the questions in a contradictory way
- the feature either hasn’t been explained in an understandable way or the person surveyed didn’t get the question
- the surveyed person accidentally picked the wrong answer
- having features in this category shouldn’t be the norm
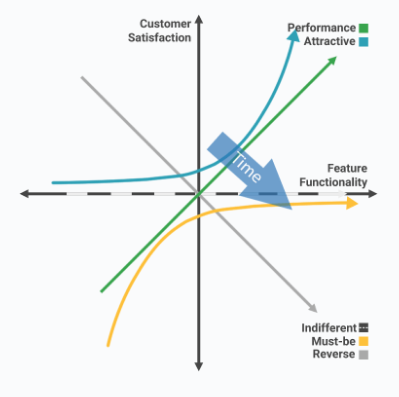
The relationship between feature functionality and users’ satisfaction can be visualized nicely. Feature functionality is represented by the x-axis, customer satisfaction by the y-axis.

Visualization of the relationship between feature functionality (x-axis) and customer satisfaction (y-axis)
Another factor taken into consideration by the Kano model is the so-called decay of delight. Kano assumes that features don’t stay within one category for an unlimited amount of time. Instead, their ability to satisfy or even delight users are subjected to a certain decay. More precisely this implies that features that were identified as a delighter in a first Kano-survey will after some time become a performance feature and ultimately a must-be feature.
As an example of this effect imagine a coffee shop serves every drink with a complimentary cookie. The first time you buy coffee there you will be pleasantly surprised by the presence of the cookie, some weeks later you’re specifically looking forward to the cookie when visiting said coffee shop. After a couple of months you’ll most likely be disappointed if your (free!) cookie is missing.
Discrete analysis using the evaluation table
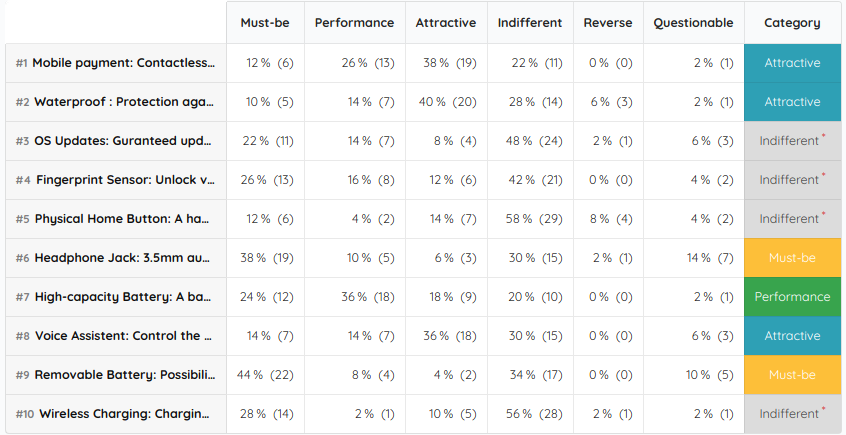
Having assessed which feature belongs in which category individually for every person surveyed, you need to assign one category to every feature based on the opinions of everybody surveyed. The evaluation table is used to keep count of how often a feature has been assigned a certain category. In sum, a feature is always assigned the category that most of the people surveyed considered it to belong to. In case of a draw between two or more categories, the following rule is applied: must-be > performance > delighter > indifferent. Assuming a feature has been assigned the category must-be and delighter by the same number of users, it will finally be assigned the category must-be feature.
Example table to clarify how the discrete analysis works
Additional methods of evaluation (continuous analysis)
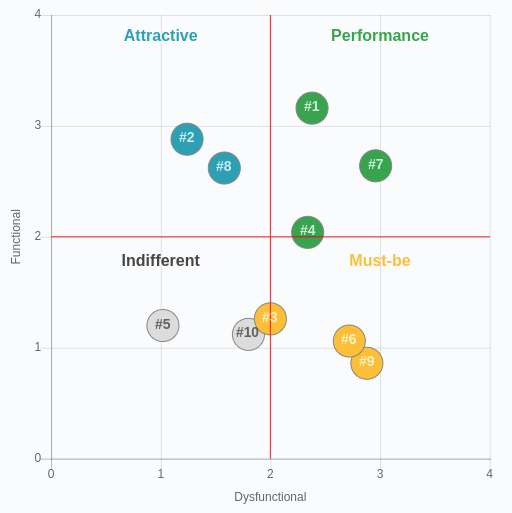
While the discrete evaluation of a Kano analysis provides you with unambiguous answers and insights very quickly, a small part of the information you gathered will get lost during this method of analysis. The reason for this is the fact that the data you gathered actually lies on a spectrum but is discretized twice during evaluation. The first discretization happens when features are assigned per surveyed person, the second time when features are assigned one category based on the answers of all participants of the survey.Usually, participants don’t assign a feature to a certain category unanimously, because of that there are different tendencies within the categories. In order to represent these tendencies, features can be visualized in a graph. To achieve this, given answers are assigned numbers between -2 and 4 (for the functional question: I like it (4), I expect it (2), I am neutral (0), I can tolerate it (-1), I dislike it (-2); for the dysfunctional question: I like it (-2), I expect it (-1), I am neutral (0), I can tolerate it (2), I dislike it (4)). Using this method of evaluation you can assign an exact value to every feature for every person you surveyed. As a next step, it is possible to calculate a mean value across all participants which can, in turn, be entered into the continuous Kano graph. The most important answers are the ones that end up in the positive (upper right) quadrant of the graph. The resulting graph shows you tendencies which are lost using the discrete evaluation.

Example graph of the continuous Kano evaluation
Consequences of the requirements analysis
Irrespective of whether you analyzed your data using the discrete or continuous method, it should show you which features are considered important by your customers and how the implementation of said features influences your customers’ satisfaction. This allows you to clearly prioritize your feature list or product backlog during product development. A general rule you can apply in order to prioritize features based on their category is must-be > performance > delighter > indifferent.Implementing not only must-bes and performance features but also making room for delighters during product development can obviously give your products a clear competitive advantage compared to competitors. Obviously, you should immediately exclude features that are assigned the category reverse from your roadmap.
Another possible way to use the categorization of features is to compare your product to the competition’s products: did they implement features you identified as performance features especially well? If so, you should try and catch up to them as quickly as possible. To sum it up, keep in mind that you should implement all must-be features and that your performance features should be able to compete with the competition’s. Finally, you have the opportunity to stand out from the crowd by implementing performance features.


 in Germany
Comments are closed.